
Outputs
Please Verify Your Inputs (Section on Left)
Enter values in the Inputs section (left) to generate your reports and insights. Click "Reset All" to set Defaults.Annual Revenue
Current
$0
+5% Boost
$0
Monthly Revenue
Current
$0
+5% Boost
$0
Net New Revenue (Monthly)
Current
$0
+5% Boost
$0
Annual Recurring Revenue (ARR)
Current
$0
+5% Boost
$0
Monthly Recurring Revenue (MRR)
Current
$0
+5% Boost
$0
Net New MRR (Monthly)
Current
$0
+5% Boost
$0
Marketing Sourced $ (Annual)
Current
$0
+5% Boost
$0
Marketing Sourced $ (Monthly)
Current
$0
+5% Boost
$0
Marketing Sourced %
Current
0%
+5% Boost
0%
Product Sourced $ (Annual)
Current
$0
+5% Boost
$0
Product Sourced $ (Monthly)
Current
$0
+5% Boost
$0
Product Sourced %
Current
0%
+5% Boost
0%
MQL+PQL Sourced $ (Annual)
Current
$0
+5% Boost
$0
MQL+PQL Sourced $ (Monthly)
Current
$0
+5% Boost
$0
MQL+PQL Sourced %
Current
0%
+5% Boost
0%
Marketing Cost Per Lead (CPL)
Current
—
+5% Boost
—
Marketing Spend ROI
Current
—
+5% Boost
—
Sales Velocity
Current
$0
+5% Boost
$0
Sales Sourced Revenue %
Current
0%
+5% Boost
0%
Lead-to-Revenue Time
Current
0 days
+5% Boost
0 days
Lead-to-Revenue %
Current
0%
+5% Boost
0%
Customer Lifetime Value (LTV)
Current
$0
+5% Boost
$0
CAC Payback Period (TTP)
Current
0 mo
+5% Boost
0 mo
LTV:CAC Ratio
Current
—
+5% Boost
—
NOTE: +5% Boost and Phased Ramp reflect GTM/RevOps improvements.
Show All
Annual Growth Rate
—
Net Revenue Retention
—
Monthly Revenue ForecastY1: —Y2: —Y3: —
Cumulative RevenueY1: —Y2: —Y3: —
Monthly MRR ForecastY1: —Y2: —Y3: —
Monthly ARR ForecastY1: —Y2: —Y3: —
Total CustomersY1: —Y2: —Y3: —
Lead Conversions (Funnel)
—
All Leads
—%
→
—d
—
SQLs
—%
→
—d
—
Opportunities
—%
→
—d
—
Closed Won
MQLs
—
Sales SQLs (Direct)
—
Total Leads
—
Lead → SQL Rate
—
Lead → Won Rate
—
Total Cycle Time
—
Lead Conversions (Drop-Off)
Stage
Overall
Projected Leads Per MonthY1: —Y2: —Y3: —
Sales VelocityY1: —Y2: —Y3: —
Time To Profit (TTP)TTP: —Lifetime: —
Service Revenue (% of Total)Y1: —Y2: —Y3: —
Service ProfitY1: —Y2: —Y3: —
NOTE: +5% Boost and Phased Ramp reflect GTM/RevOps improvements.
Show All
Leads Pipeline & Conversions
MQLs
—
×
MQL Conv %
—
=
Converted SQLs
—
+
Sales SQLs
—
=
Total SQLs
—
×
SQL → Opp %
—
=
Total Opps
—
Deal Pipeline Conversions & Revenue
Total Opps
—
×
Win Rate %
—
=
Closed Won
—
×
Avg MRR Deal
—
=
New MRR
—
New ARR (New MRR x 12)
—
Sales Velocity
Total Opps
—
×
Win Rate %
—
×
Avg Deal Value
—
÷
Sales Cycle (Deal Velocity)
—
=
Sales Velocity
—
Customer LTV & Insights
Avg Annual MRR
—
×
Gross Margin
—
×
Customer Lifetime
—
=
Recurring LTV
—
LTV
—
LTV
—
÷
CAC
—
=
LTV:CAC
—
NOTE: All calculations are based on your inputs only.
GTM & RevOps
Inputs & Calculations
Benchmarks & Opportunities
Customer Lifecycle (Bow-Tie) Impact
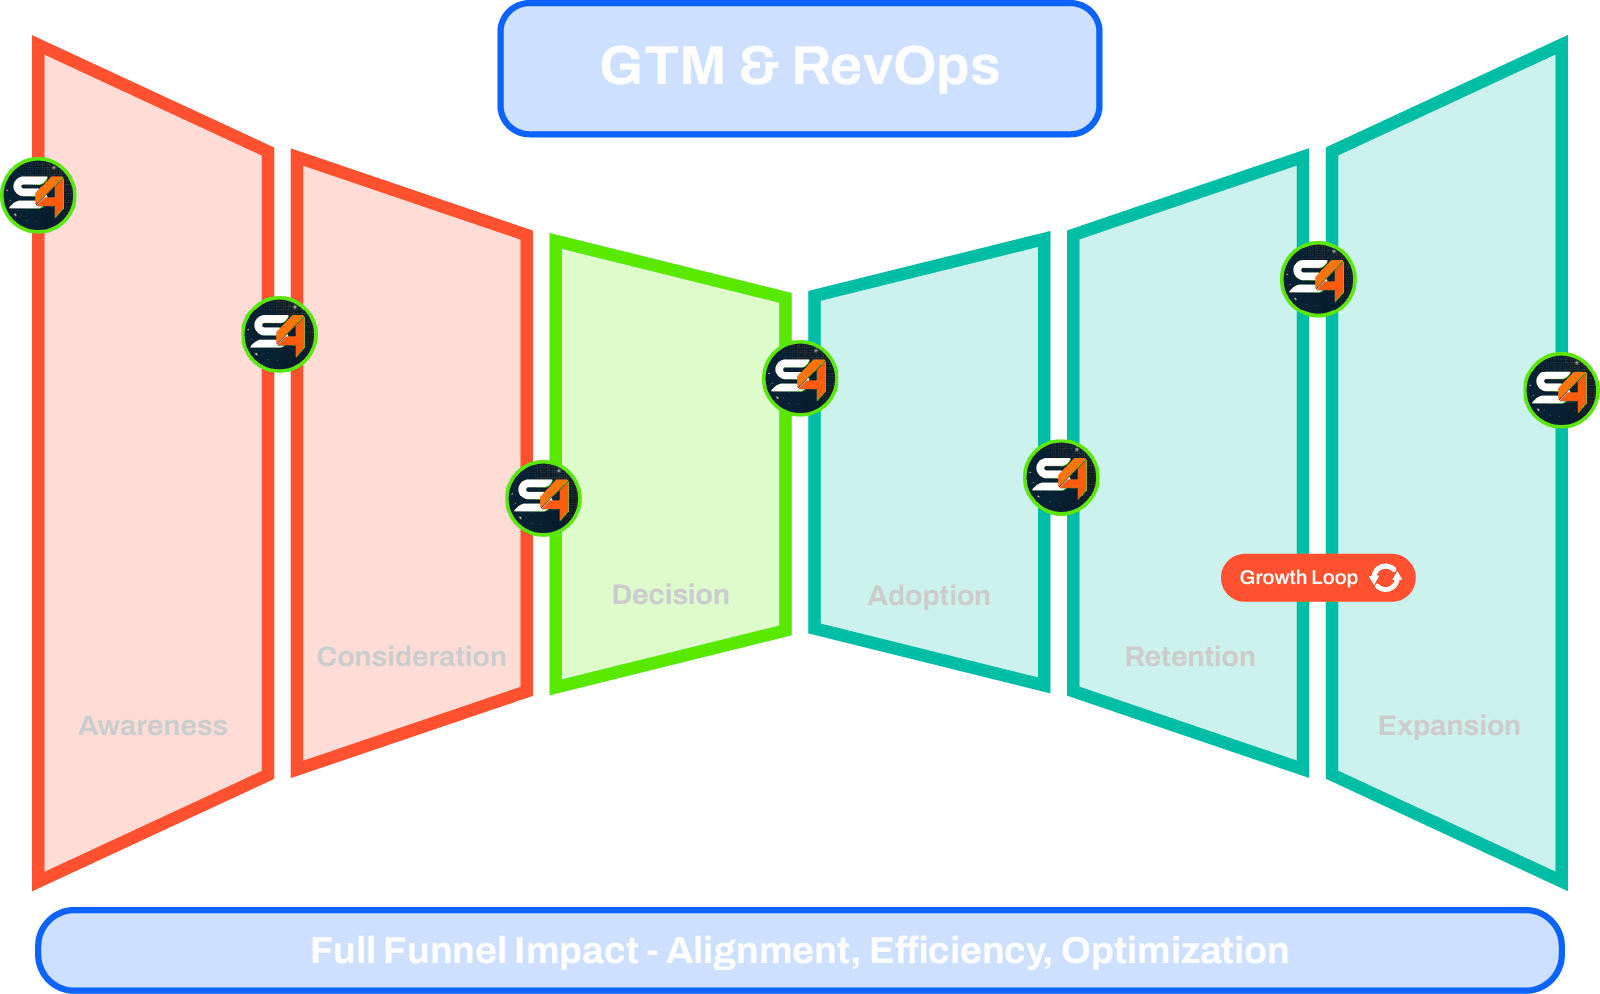 Click to Enlarge
Marketing
Inputs & Calculations
Benchmarks & Opportunities
Customer Lifecycle (Bow-Tie) Impact
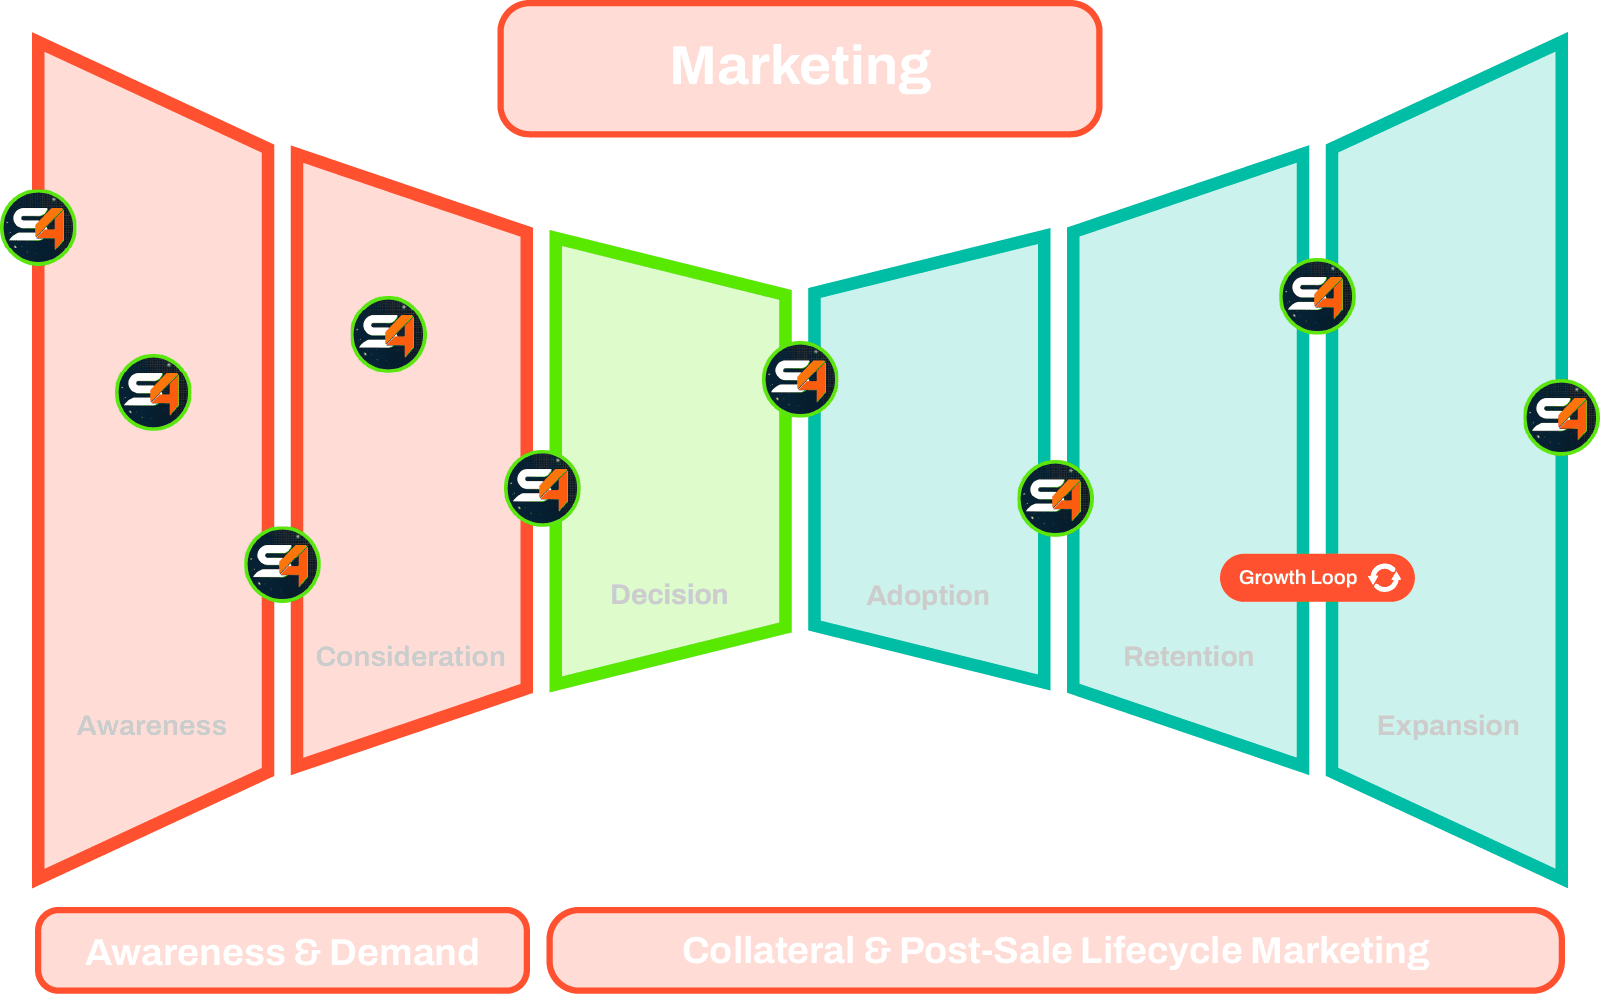 Click to Enlarge
Sales
Inputs & Calculations
Benchmarks & Opportunities
Customer Lifecycle (Bow-Tie) Impact
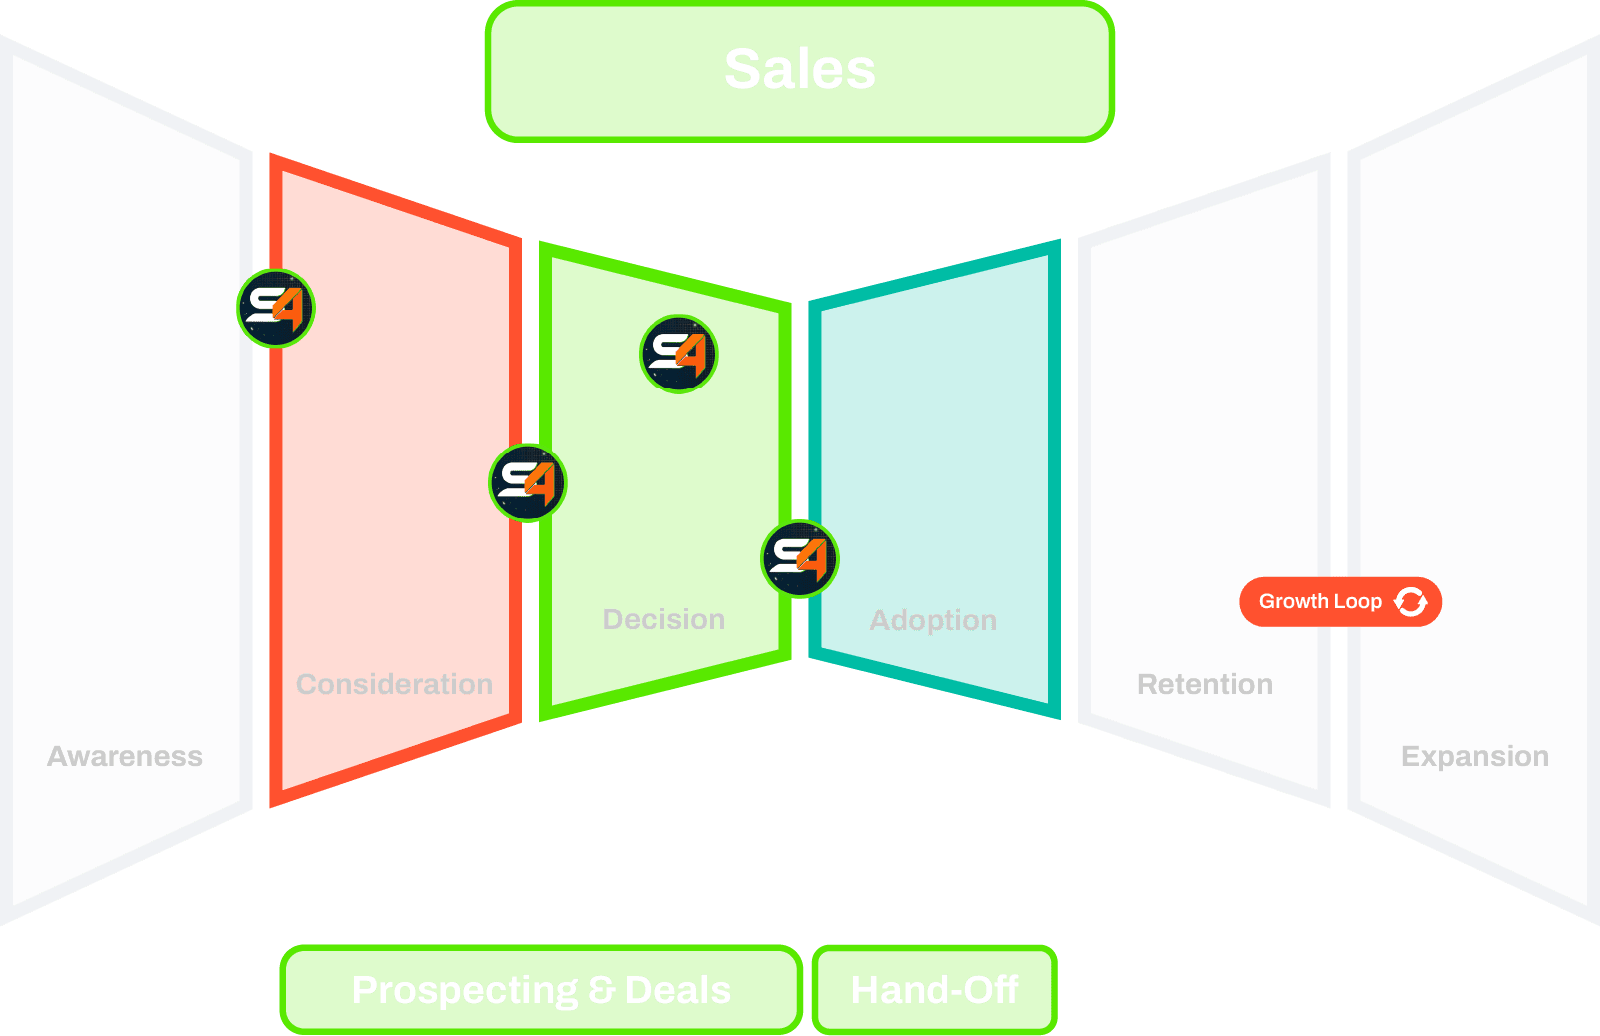 Click to Enlarge
CS & Service
Inputs & Calculations
Benchmarks & Opportunities
Customer Lifecycle (Bow-Tie) Impact
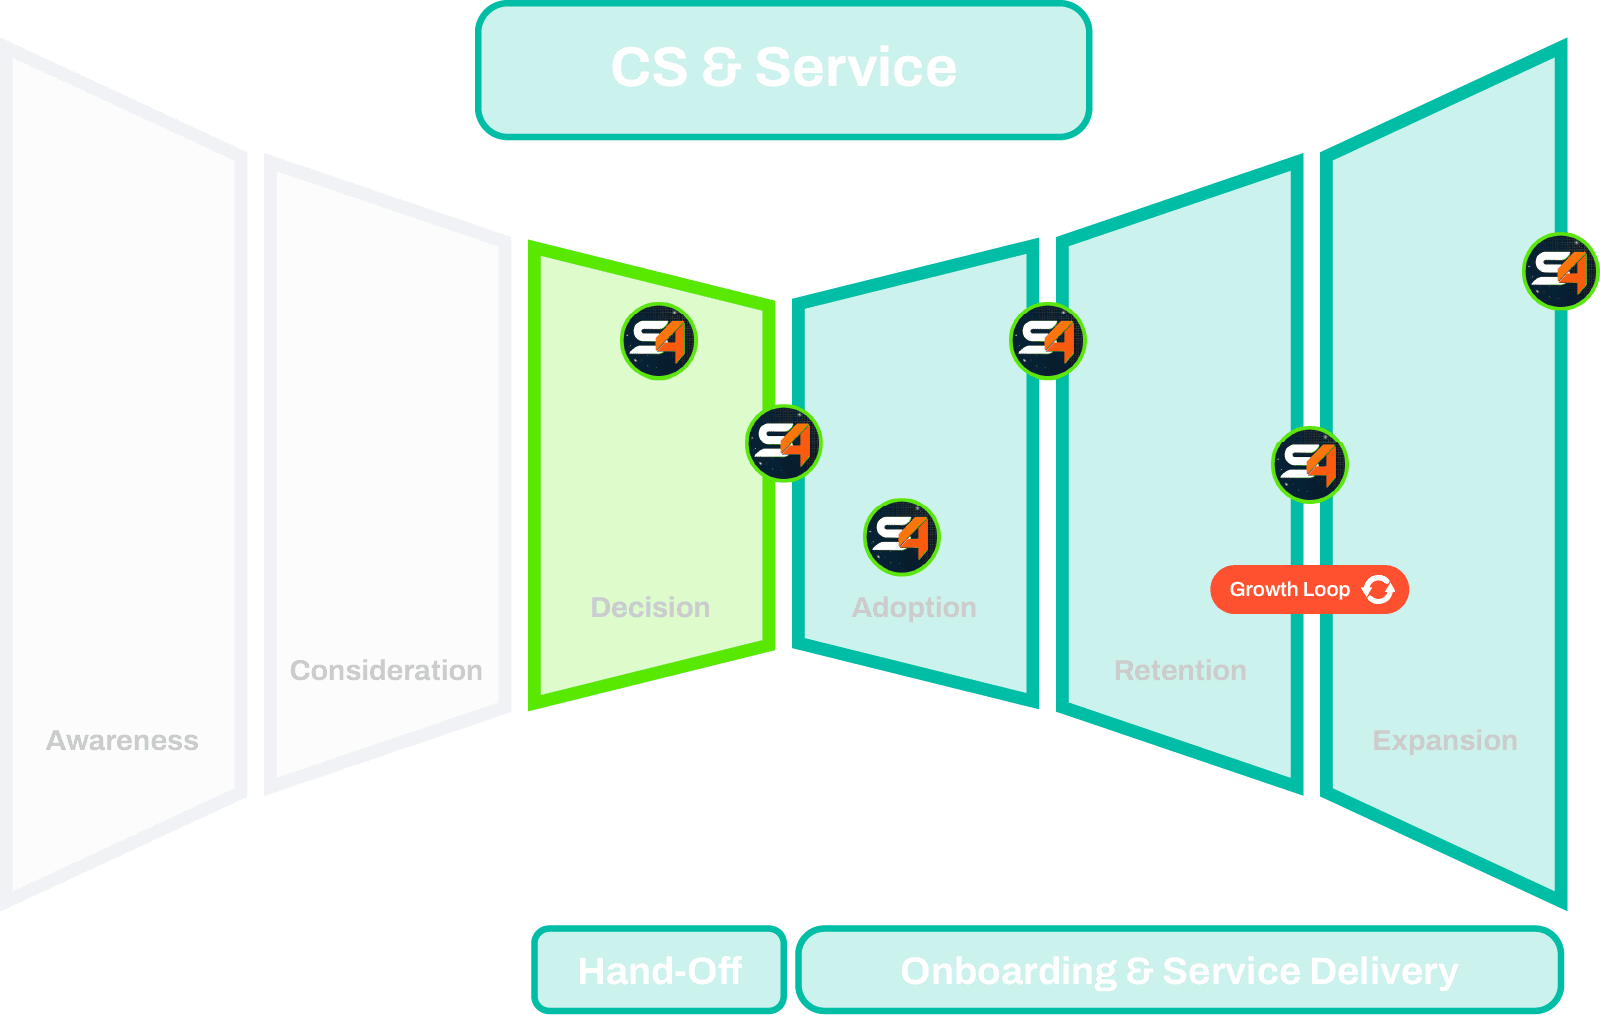 Click to Enlarge
Based On Your Inputs—You Can Expect:
Current Annual Revenue: —
Annual RevOps Investment: —
Monthly RevOps Investment: —
Year 1
—
Projected Y1 Revenue Impact
—
—
Year 2
—
Projected Y2 Revenue Impact
—
—
Year 3
—
Projected Y3 Revenue Impact
—
—
 Full Fractional Team: —/Mo
 Squad4's pricing for Fractional GTM/RevOps is aligned with the RevOps budget. Our fractional/embedded team augments and empowers your GTM teams at significant cost savings compared to FTEs.
Ready For #ExitVelocity?
One simple click for you—one giant boost for your revenue engine!
We hope you found value in the Revenue LaunchPad™. Now—how can we help you build yours? 🫡 🚀🔥